Elasticsearch in garbage collection hell
After several weeks of intense testing, fixing configuration problems, re-indexing data and experiencing problems when upgrading our Kibana indices, we managed to upgrade our 36 Kibana instances and our Elasticsearch cluster in production from version 5.6.16 to 6.7.1 a couple of weeks ago.
We could not believe it but finally we had over 1.300 indices, 100TB of data, 102 000 000 000 documents and 18 Elasticsearch nodes running the last version of the elastic 6.x series at the moment.
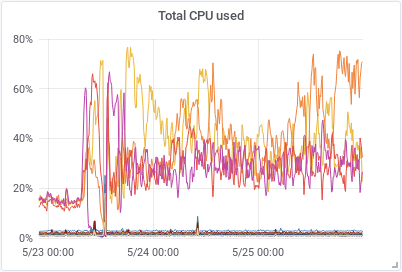
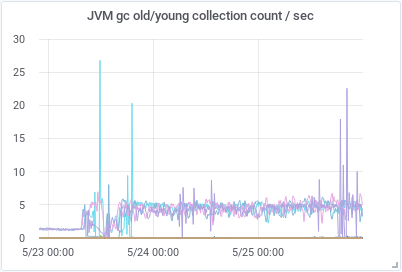
Our joy did not last long, after years of stability with old versions all our hot-nodes, the ones indexing new data, with tons of CPU and state of the art SSD disks went bananas. In a matter of a few hours after the upgrade was finished we were in hell and we did not know what we had done wrong to deserve the situation we were in.
Our indexing rate was between 10 000 and 20 000 new documents per second during normal operation with 40 000 - 50 000 peaks when something special happened.
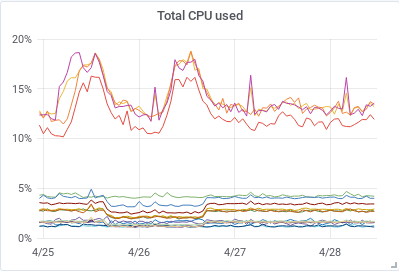
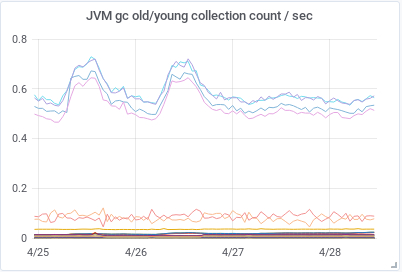
This is how our CPU use and the old/young collection count / sec looked like during a normal period before we upgraded.
|
|
|---|---|
|
|
We still could index all logs arriving in our system but the performance of the system was seriously affected. Moving data around was a pain and normal operations took ages to finish. Not to mention that we went from having a lot of extra resources and no plans of investing in new hardware to a very uncertain situation.
What had we done wrong during the upgrade? Was the new version so inefficient that it needed 4 or 5 times more resources than the old version? Everything happened so suddenly that we did not see it coming, we did not have a clue of what was happening.
We started investigating the situation. The first thing we did was to check all our Grafana dashboards with information about all the components in our system.
The amount of data arriving in the system was normal, the network and disk activity was also normal, as well as the amount of searches running. But we had a huge amount of CPU use in some of the hot-nodes in the cluster. Some of them were using 80-90% of their capacity, we are talking about servers with 48CPUs. Another graph that went bananas was the one showing the amount of java heap in use, the nodes using all the CPU power were using also 80-90% of the heap available. I addition the graph showing the amount of GC/sec showed that something was happening in this area also.
After this first evaluation it was clear to us that garbage collection was probably the reason why the servers were using so many resources. But so suddenly? Why? What could be do with this?
We are not java experts, we have been running Elasticsearch for years using all the default JVM values except for -Xms and -Xmx, these two values have always been 31G in our servers. We started reading tons of documentation, blogs and forums without finding out something concrete to do. A lot of information about old versions of elasticsearch and even more information about old JVM versions, not to mention the amount of different versions out there, all of them behaving different and using different parameters. This was not going to be easy and in the mean time our production system was in hell.
It was obvious that the new version had triggered something in the JVM and/or was using memory in a different way. Maybe we had to much HEAP allocated?, but we were not using more than 50% of the total memory in the servers and 31G was well under the 32G recommended limit, the cutoff that the JVM uses for compressed object pointers (compressed oops), the logs confirmed that:
[INFO][o.e.e.NodeEnvironment][hostname] heap size [29.9gb], compressed ordinary object pointers [true]
Maybe the problem was that the garbage collector used by Elasticsearch with Java 8, ConcMarkSweepGC (CMS) could not cope with 31G of HEAP and how the application was using memory. At least everybody was saying that this GC collector is not optimal if you have a lot of HEAP allocated. The newer G1GC collector was in theory much better with our configuration. The only problem was that Elasticsearch does not support this collector if you are running Java 8, you have to upgrade to Java 11 and we did not think it was a good idea to upgrade to version 11 without testing it before.
We tried to decrease the heap size to 28G to see if this was the problem, maybe ConcMarkSweepGC (CMS) could do its job with less heap size allocated. But just as we did this and restarted the nodes, another problem arose. We had been using indices.breaker.total.limit = 55% for years to avoid out og memory problems and when we started the nodes with 28G heap size we started seeing this type of errors:
[internal:index/shard/recovery/start_recovery]]; nested: CircuitBreakingException[[parent] Data too large, data for [<transport_request>]
would be [16215377502/15.1gb], which is larger than the limit of [15984463052/14.8gb],
usages [request=0/0b, fielddata=0/0 b, in_flight_requests=64216/62.7kb, accounting=16215313286/15.1gb]]; ], markAsStale [true]]
Wow, now we could not recover all indices and for the same reason some of the nodes were “disappearing” from the cluster. We changed the heap size back to 31G and started the cluster again while we continued thinking about what to do.
We were getting also a lot of logs of this type:
[INFO][o.e.m.j.JvmGcMonitorService][hostname][gc][533] overhead, spent [390ms] collecting in the last [1s]
And just a few of this type:
[WARN][o.e.m.j.JvmGcMonitorService][hostname][gc][old][6546][116] duration [21.3s], collections [1]/[21.4s], total [21.3s]/[16.3m],
memory [30.4gb]->[24.3gb]/[30.7gb], all_pools {[young] [2gb]->[1.1gb]/[2.1gb]}{[survivor] [176mb]->[0b]/[274.5mb]}{[old] [28.2gb]->[23.1gb]/[28.3gb]}
Why were we getting so many “gc overhead” logs? We did not find out the different between these two type of logs, the second one is generated when the GC does its job, but what about the first one?. And why were we using only around 2G out of 31G for the young pool memory? What was the relationship between the young and the old pool? One of the things we were seeing was that the GC count for the young pool was almost 5 times higher than before. Maybe the young pool memory was to small?
We spent some time trying to understand how the young and the old pool work and the relationship between them. Again, a lot of old information very dependent of the version you were using. But one thing was common in many places, the ratio between the young and the old pool was normally 1:2 or 1:3 and the default ratio was 1:2 (33% young / 66% old). Well, if this was right our system was not configured right because 2G is around 6.5% of 31G, or almost a 1:14 ratio. What was happening here?
We found a place with some good information about how to find the values used by the JVM in your system, we needed to find out which default configuration values the JVM was using. With this command we got a list with all the parameters the JVM was using and their values. Many of these values are computed dynamically by the JVM when Elasticsearch is started if you do not define them explicitly.
java -Xms31G -Xmx31G -XX:+UseConcMarkSweepGC -XX:+UnlockDiagnosticVMOptions -XX:+PrintFlagsFinal -version
In our system, 873 parameters, 77 of them only to configure the ConcMarkSweepGC (CMS) collector we were using.
Too many options, we focused on the parameters defining the young / old pools, the ratio and the one defining the number of threads used by CG (ParallelGCThreads). This last parameter had to be equal to the number of CPUs in our servers according to the information we found.
# java -Xms31G -Xmx31G -XX:+UseConcMarkSweepGC -XX:+UnlockDiagnosticVMOptions -XX:+PrintFlagsFinal -version |
egrep -i "( NewSize | OldSize | NewRatio | ParallelGCThreads )"

    uintx NewRatio                                  = 2                                   {product}
    uintx NewSize                                  := 2878930944                          {product}
    uintx OldSize                                  := 30407065600                         {product}
    uintx ParallelGCThreads                         = 33                                  {product}
First surprise, the value of ParallelGCThreads was completely wrong, it showed a value of 33 when the servers had 48CPUs available. The default ratio value was right (NewRatio: 2) but the young (NewSize) and old (OlsSize) pool sizes were wrong, they were not defined using a 1:2 ratio.
Did the JVM know something that we did not know or was it completely wrong? Well, we had nothing to loose and we had a feeling the JVM was wrong. We run the command again with the parameters we wanted to try and things began to look better:
# java -Xms31G -Xmx31G -XX:ParallelGCThreads=48 -XX:NewRatio=3 -XX:+UseConcMarkSweepGC -XX:+UnlockDiagnosticVMOptions -XX:+PrintFlagsFinal -version |
egrep -i "(NewSize | OldSize | NewRatio | ParallelGCThreads)"

    uintx NewRatio                                 := 3                                   {product}
    uintx NewSize                                  := 8321499136                          {product}
    uintx OldSize                                  := 24964497408                         {product}
    uintx ParallelGCThreads                        := 48                                  {product}
We read somewhere that 1:3 was a good ratio for Elasticsearch so we tried this first and defined -XX:NewRatio=3 and -XX:ParallelGCThreads=48 explicitily in /etc/elasticsearch/jvm.options file.
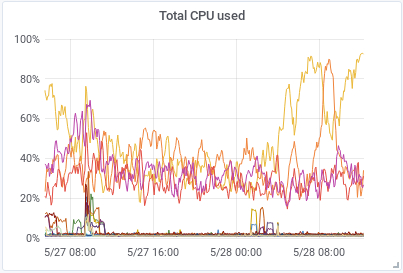
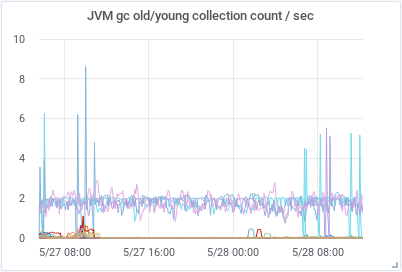
After restarting the cluster things began to happen. The amount of GC/sec for young pool decreased over 50% in the hot-nodes but increased for old pool in the cold-nodes. Things got a little better in the hot-nodes but worst in the cold-nodes.
|
|
|---|
We had to continue trying things and the next thing we did was to increase even more the young pool defining -XX:NewRatio=2 (ratio1:2 - 33% young / 66% old).
# java -Xms31G -Xmx31G -XX:ParallelGCThreads=48 -XX:NewRatio=2 -XX:+UseConcMarkSweepGC -XX:+UnlockDiagnosticVMOptions -XX:+PrintFlagsFinal -version |
egrep -i "(NewSize | OldSize | NewRatio | ParallelGCThreads)"

    uintx NewRatio                                 := 2                                   {product}
    uintx NewSize                                  := 11095310336                         {product}
    uintx OldSize                                  := 22190686208                         {product}
    uintx ParallelGCThreads                        := 48                                  {product}
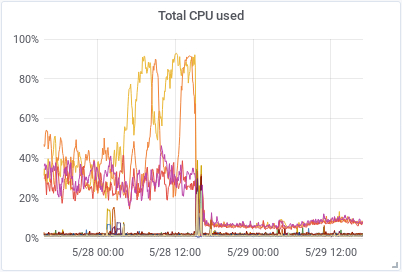
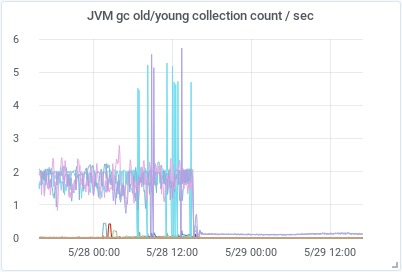
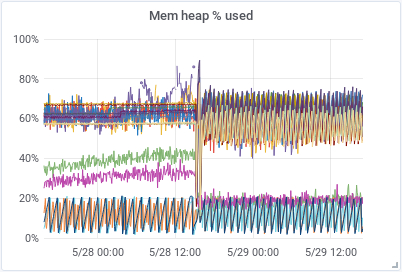
We also increased the indices.memory.index_buffer_size to 20% to have more memory available for all the shards receiving new data and index.refresh_interval to 30s to decrease the expensive operation of making new documents visible. These three changes had a huge impact in how the cluster worked afterwards. As we can see in the graphs below, the amount of CPU used and GC/sec decreased dramatically and the HEAP used got very stable and predictable.
|
|
|---|---|
|
It has been one week since we fixed our Elasticsearch cluster and the situation is still stable and without any problems.
Things we have learned on the way:
- We still do not know why the CPU/GC behavior changed radically after upgrading to version 6.7.1.
- Memory management in Java is not a trivial thing when you have a large system processing a lot of data.
- The documentation available about GC tuning is nontrivial, very version dependent, old in many cases and not accurate.
- We need to learn more about how to tune and configure a JVM.
- You can get in trouble with GC very fast and without prior notice.
- Garbage collection hell is not a nice place to be.
Links: